
We designed and built Nations Inquiry, an independent reference that ranks 183 countries using public statistics and traces every figure back to the organization that published it.
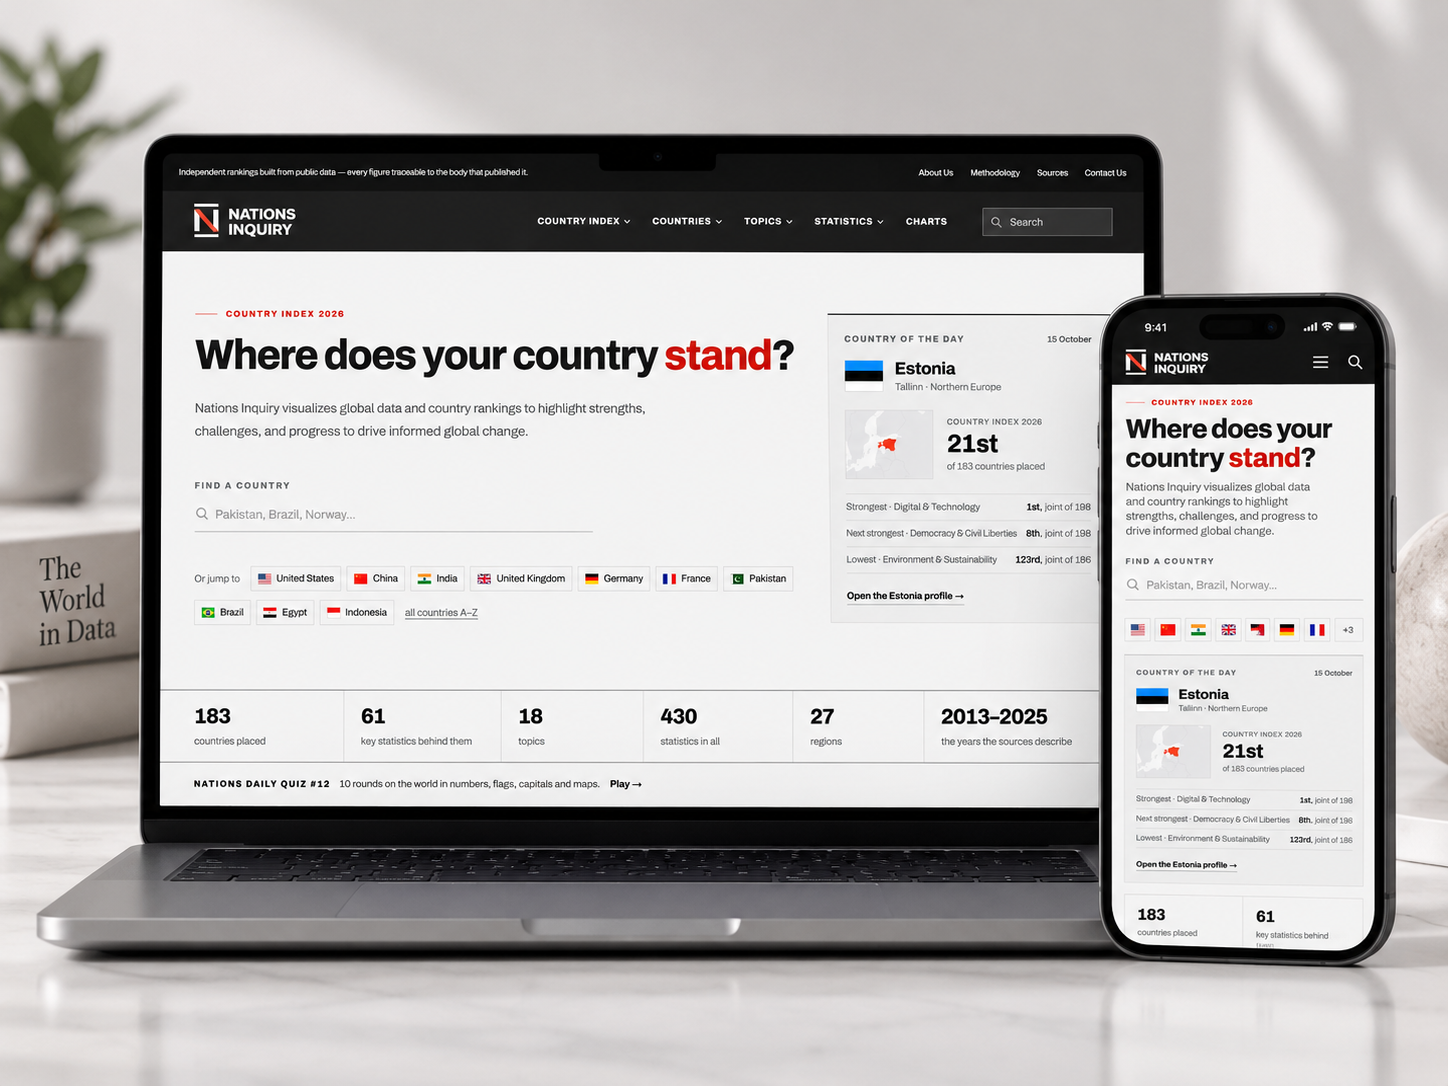
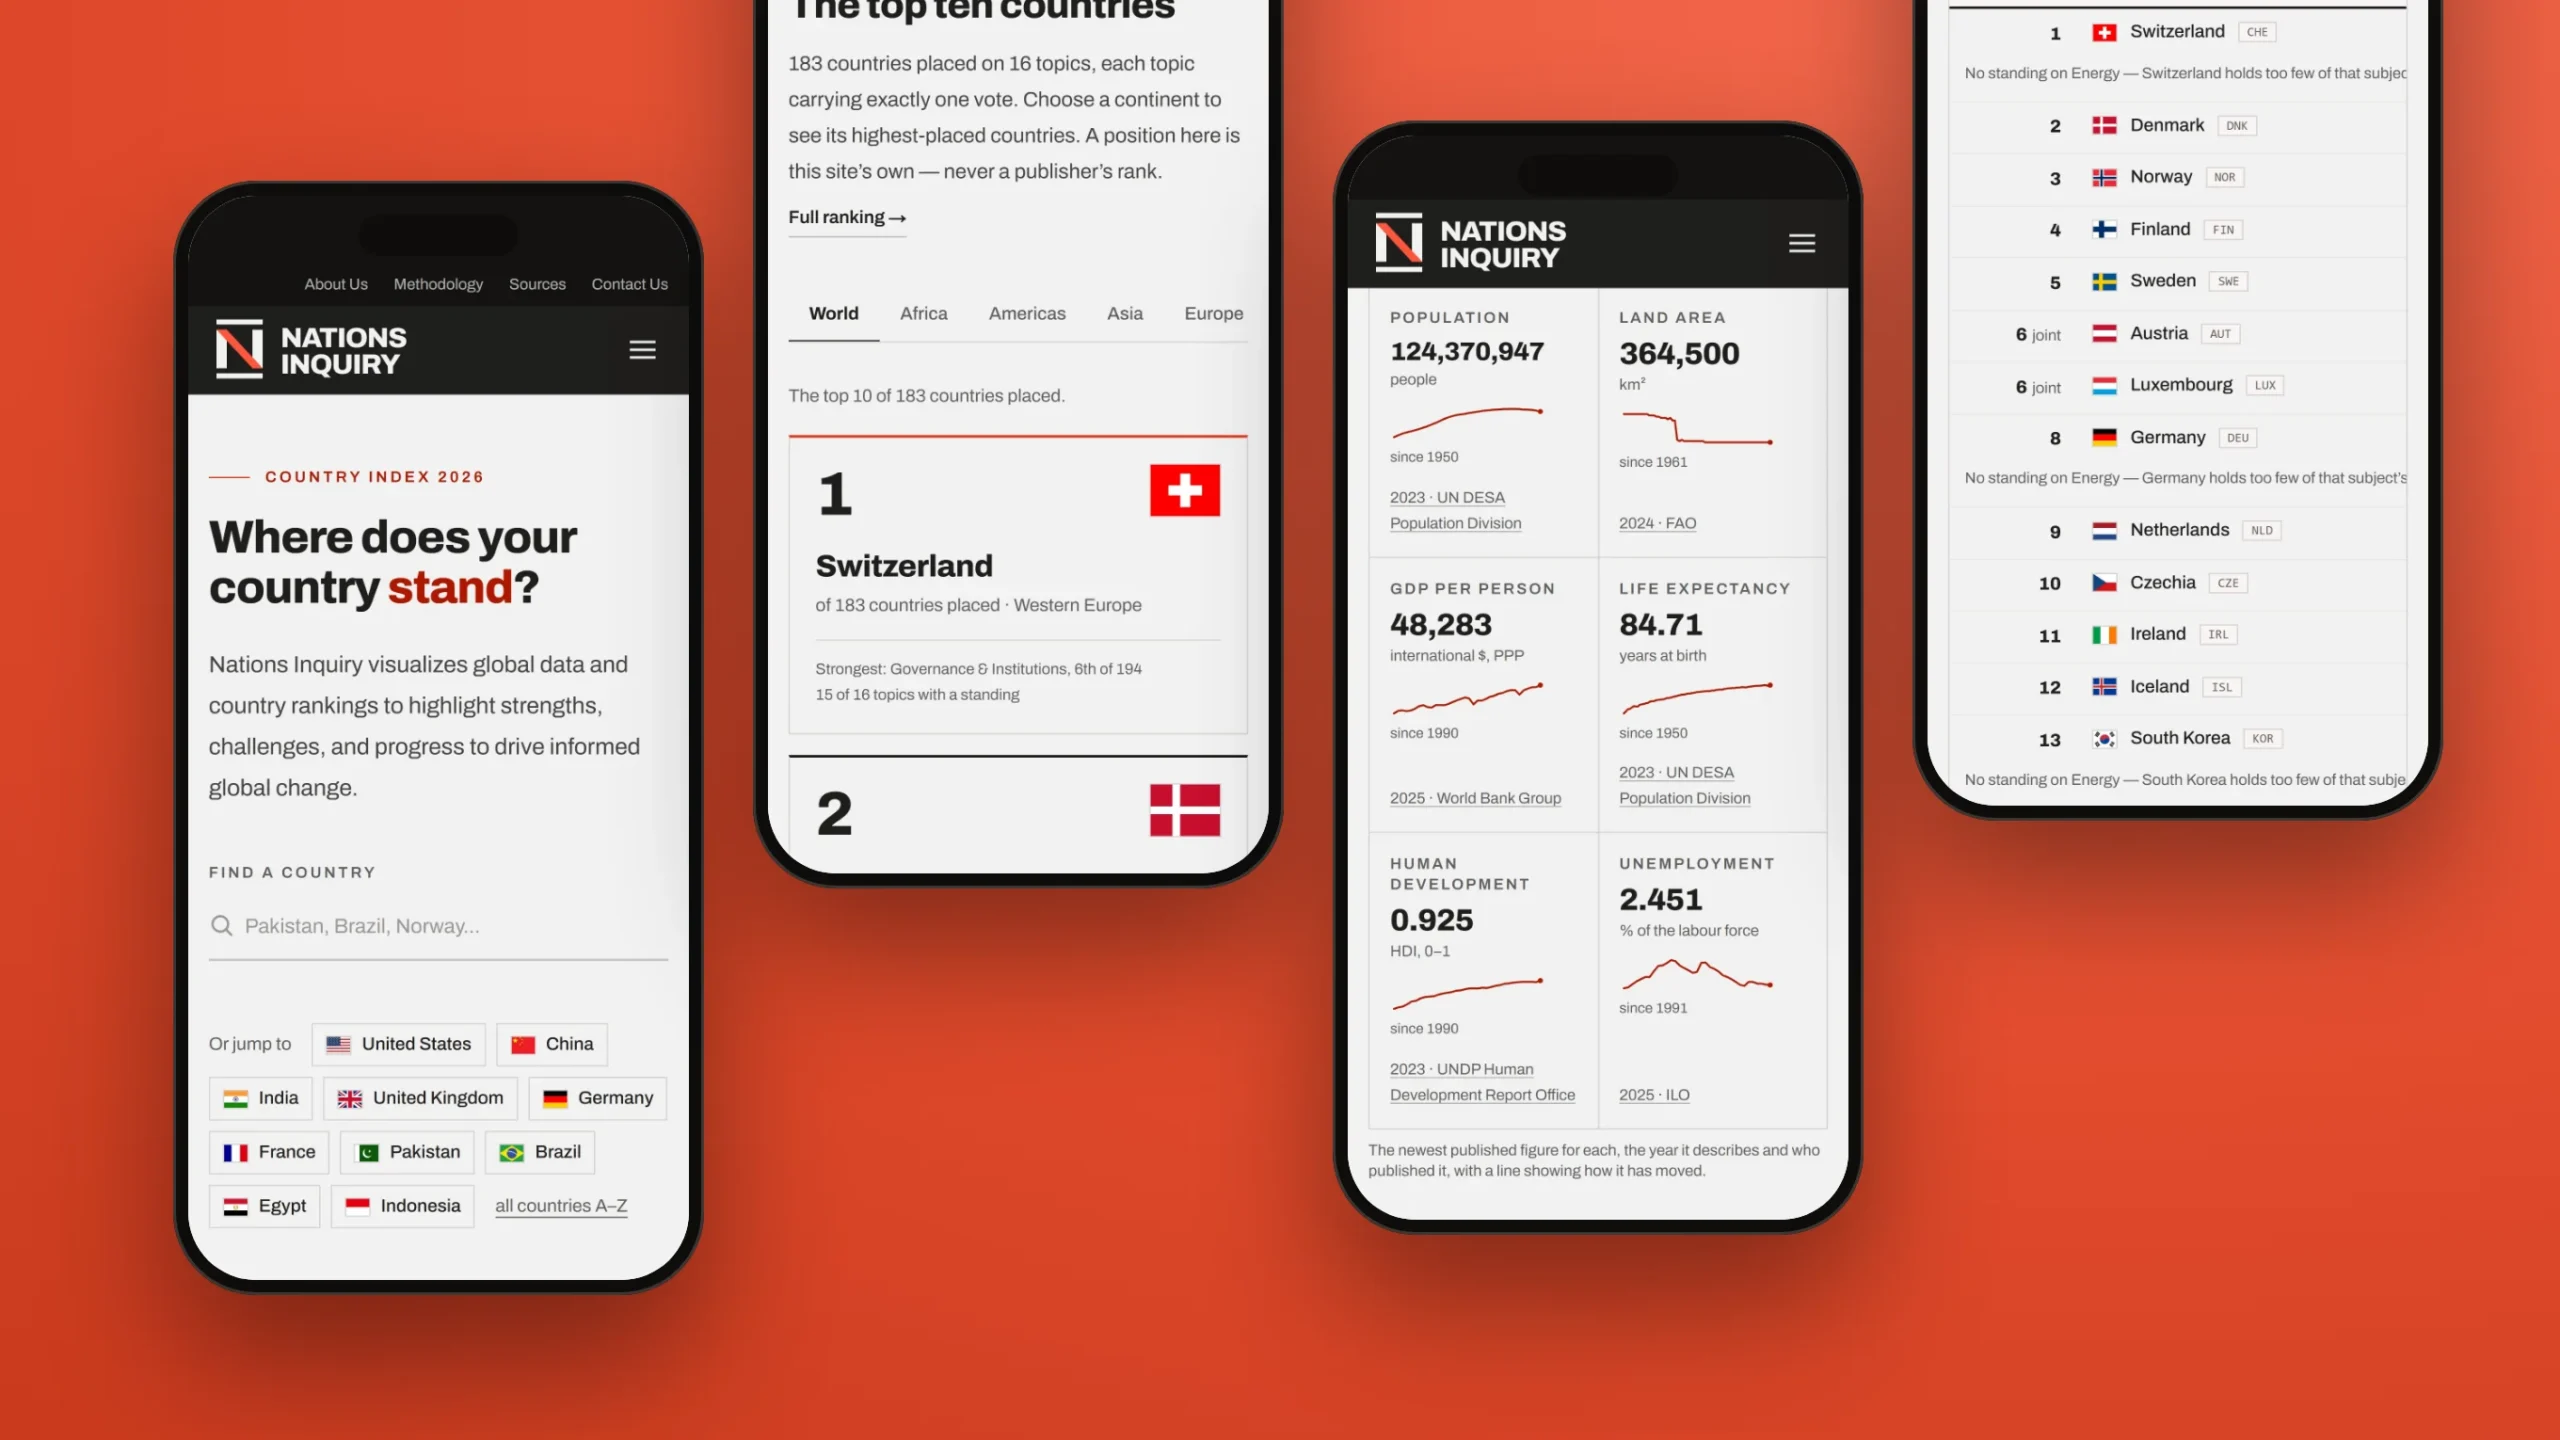
01 / The live platform on desktop and mobile
- Client
- Nations Inquiry
- Category
- Data & research platform
- Website
- nationsinquiry.com
The mission
Rankings youcan check.
Most country rankings ask you to take the number on trust. Nations Inquiry had to do the opposite: give the position, then show exactly how it got there.
The challenge
The world's statistics are scattered across dozens of publishers, each with its own editions, methods and licenses. Line them up carelessly and you get a tidy league table that hides how old a figure is, who produced it and what's missing.
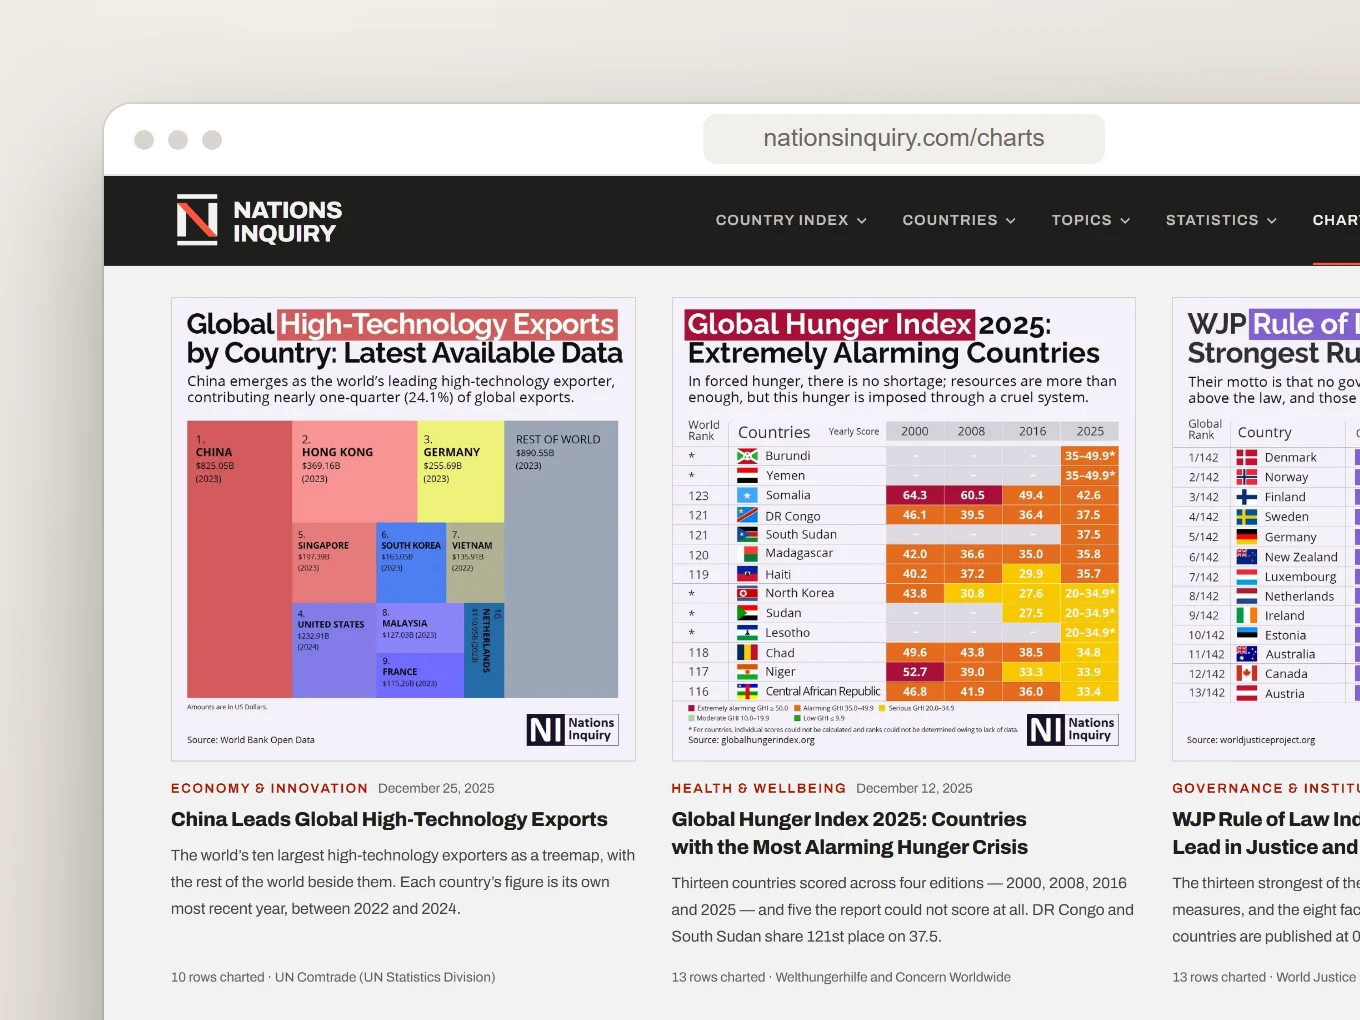
The project began with infographics. It needed to grow into a lasting reference that could hold hundreds of statistics and more than two hundred country pages, and still feel simple to someone who only wants to know where their country stands.
Our approach
We started with that one question and put it at the top of the homepage: where does your country stand? From there, each page opens one level deeper. A country leads to its topics, a topic to its statistics, and a statistic to the publisher that issued it.
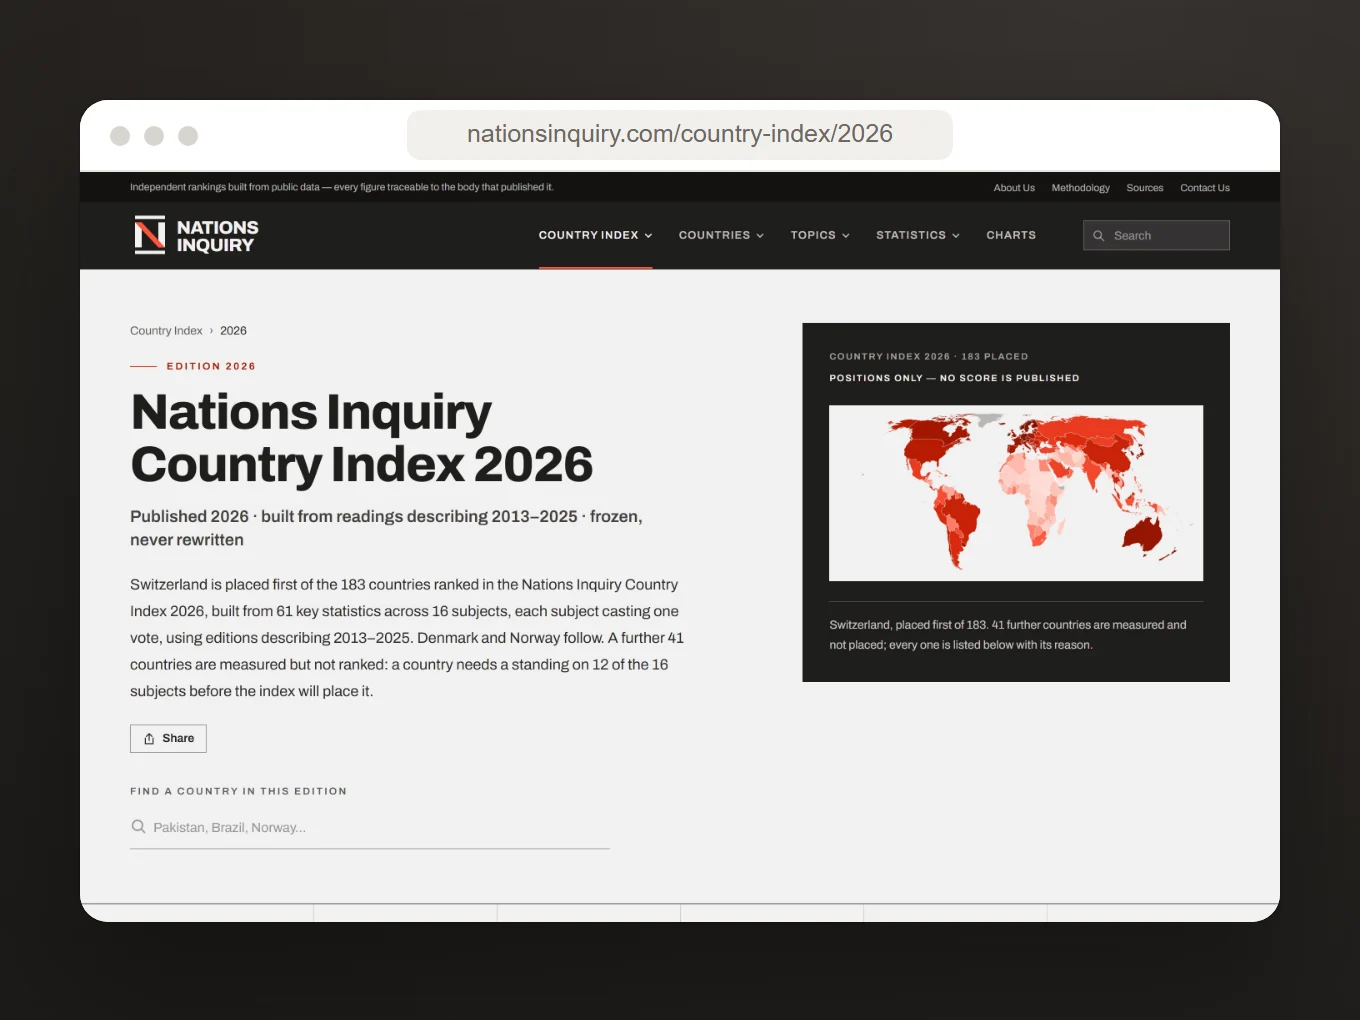
We also gave the numbers an honest vocabulary. A rank is what a publisher printed. A derived position is clearly labeled as the site's own ordering. A standing is always named with its edition. The index publishes positions only, never a made-up score, so nothing looks more precise than it is.
The result
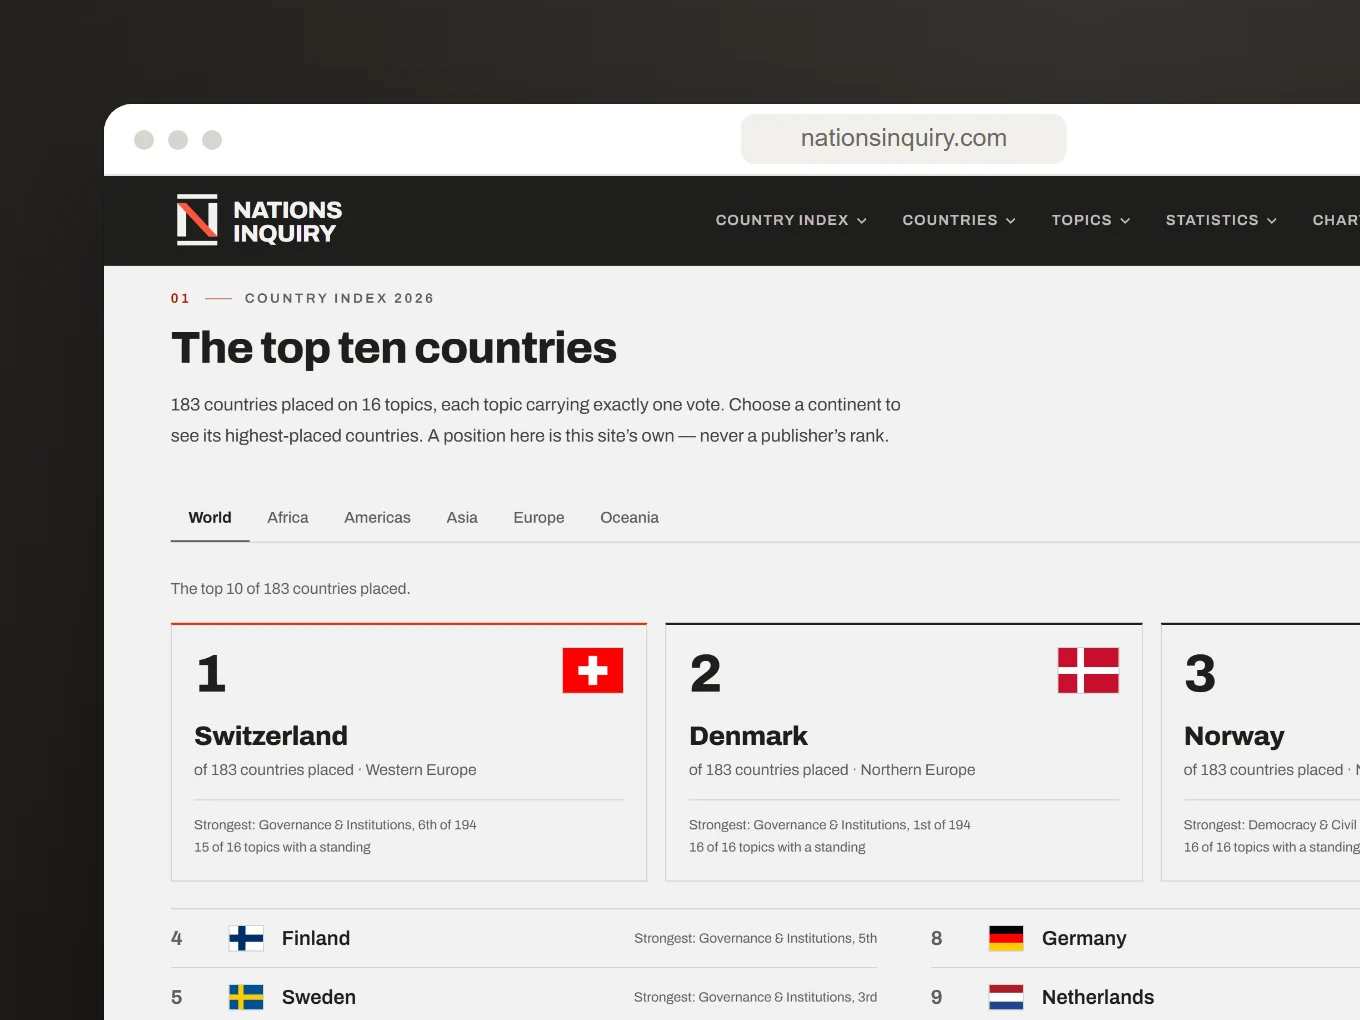
Nations Inquiry now brings together 430 statistics from 70 publishers, 225 country profiles and 18 topics. Its Country Index 2026 places 183 countries using 61 key statistics, with 16 topics casting one vote each.
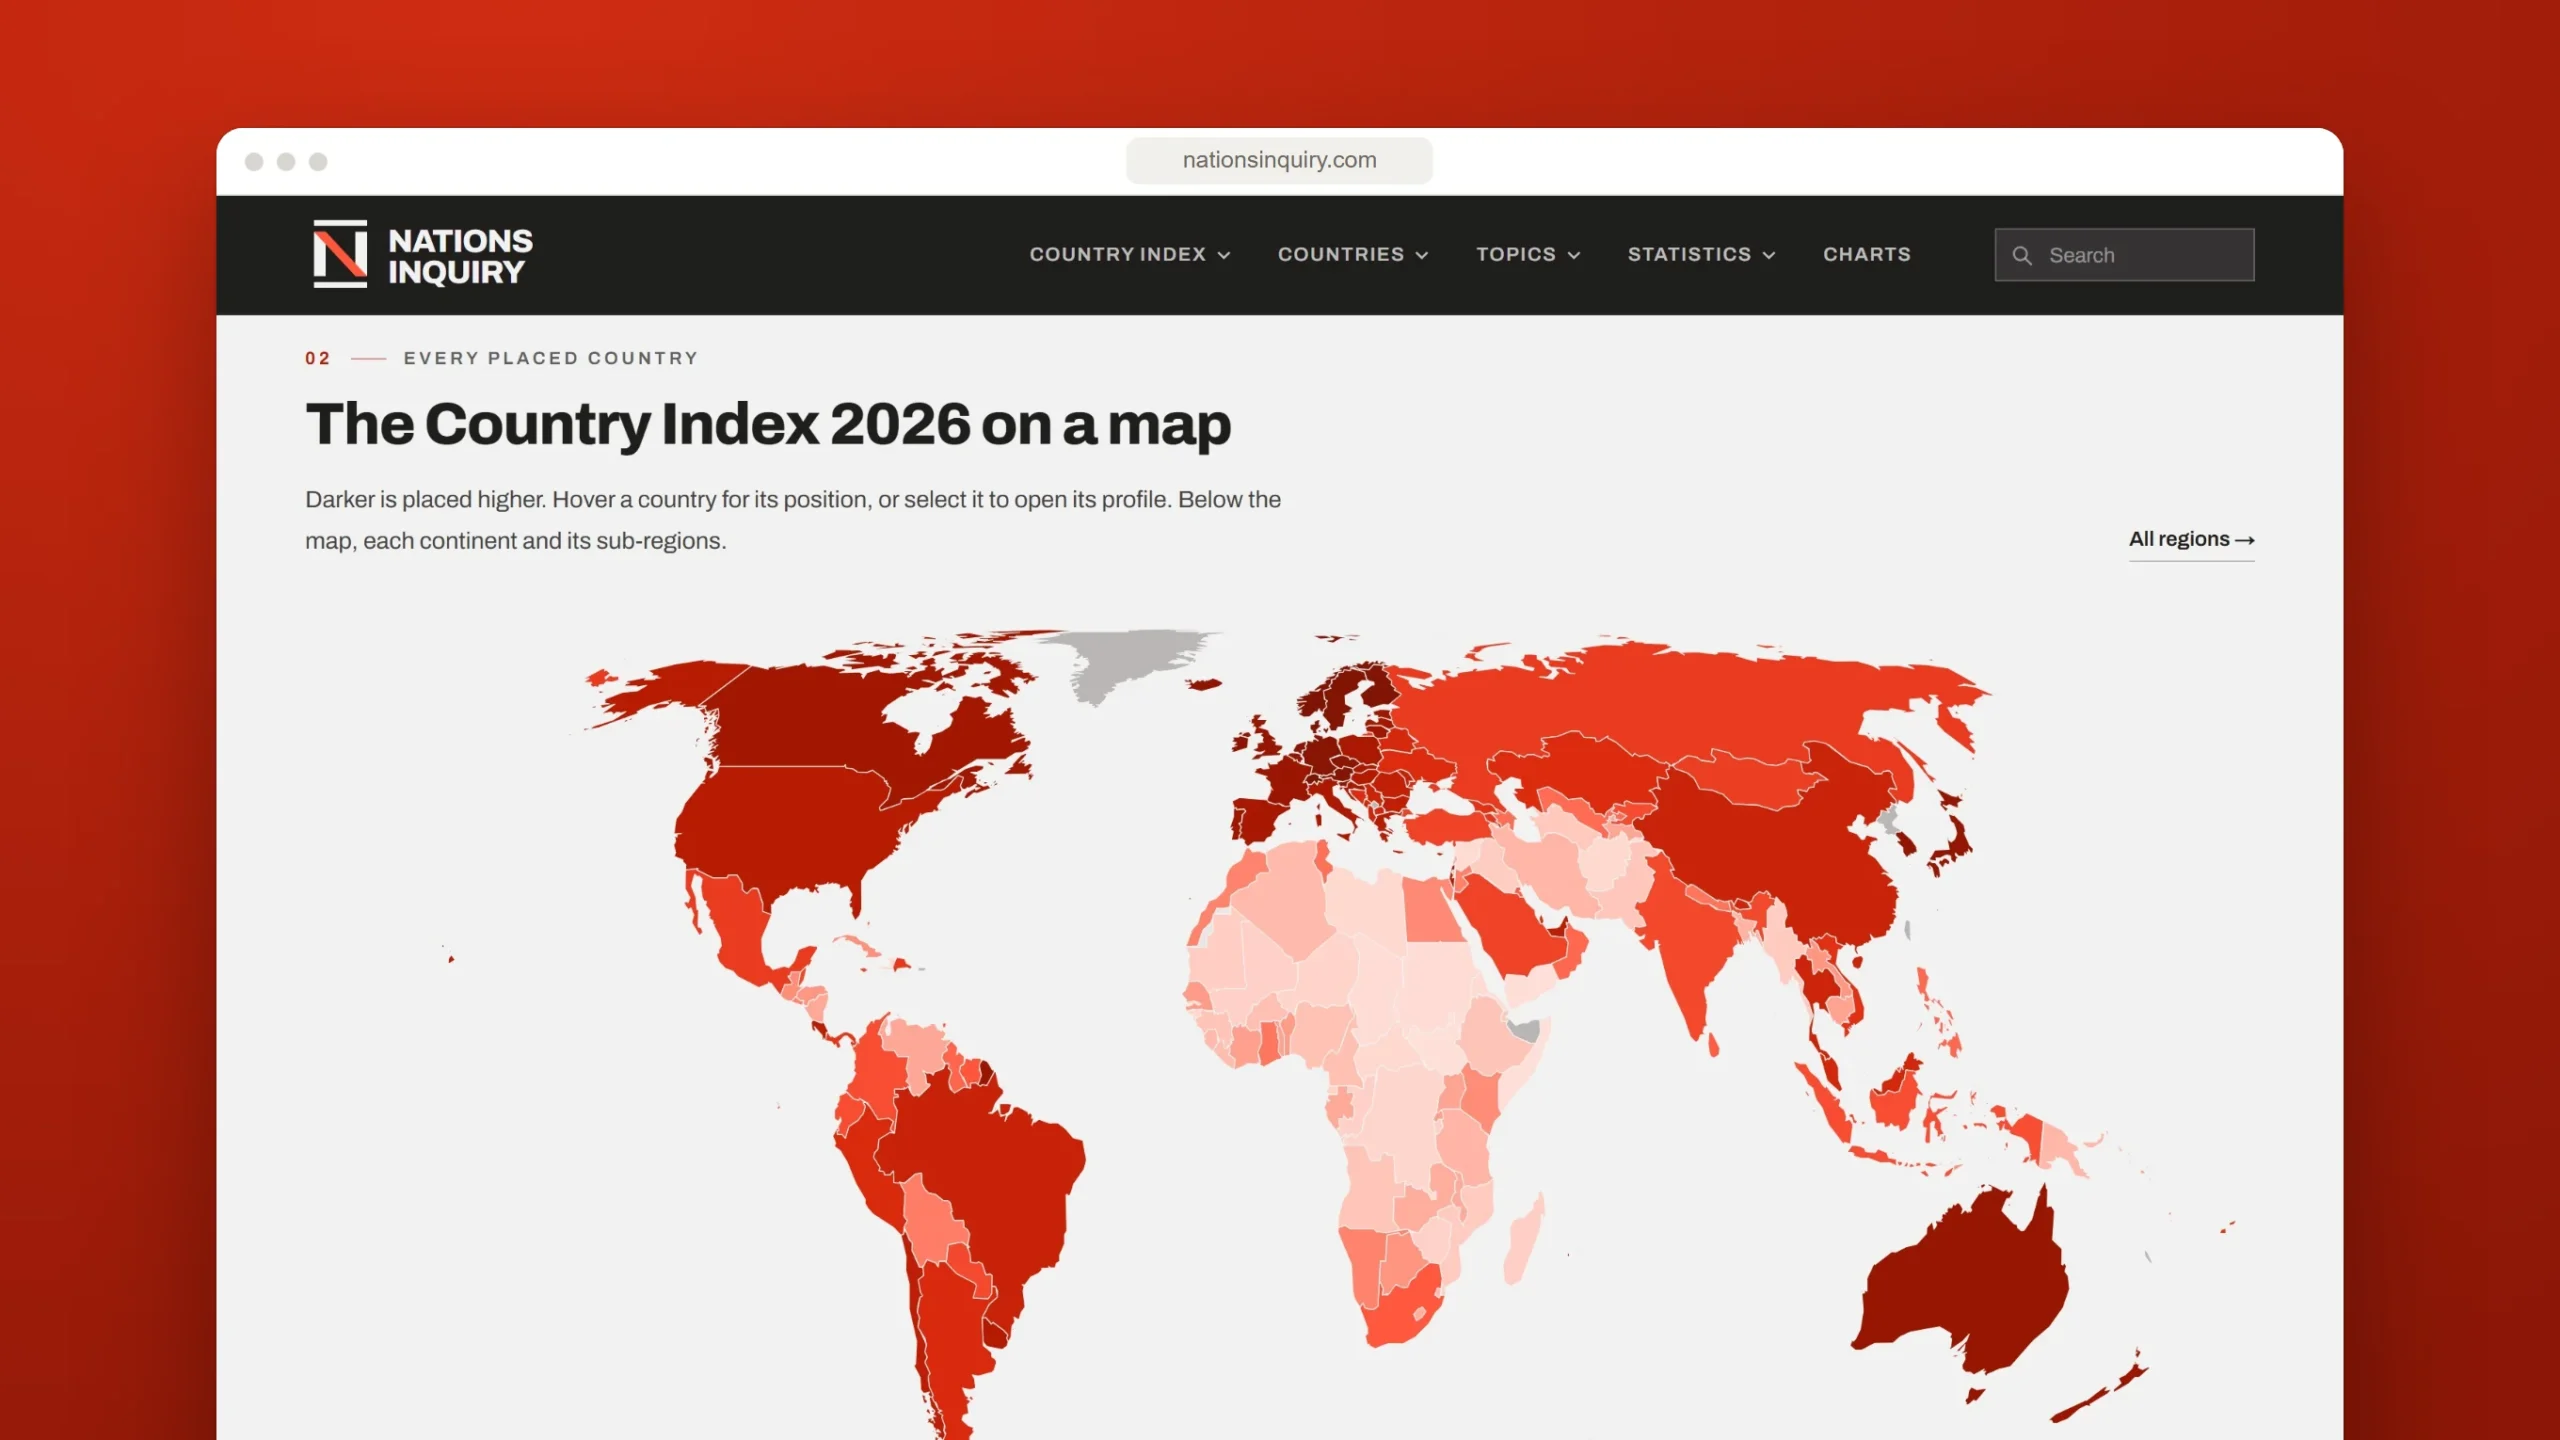
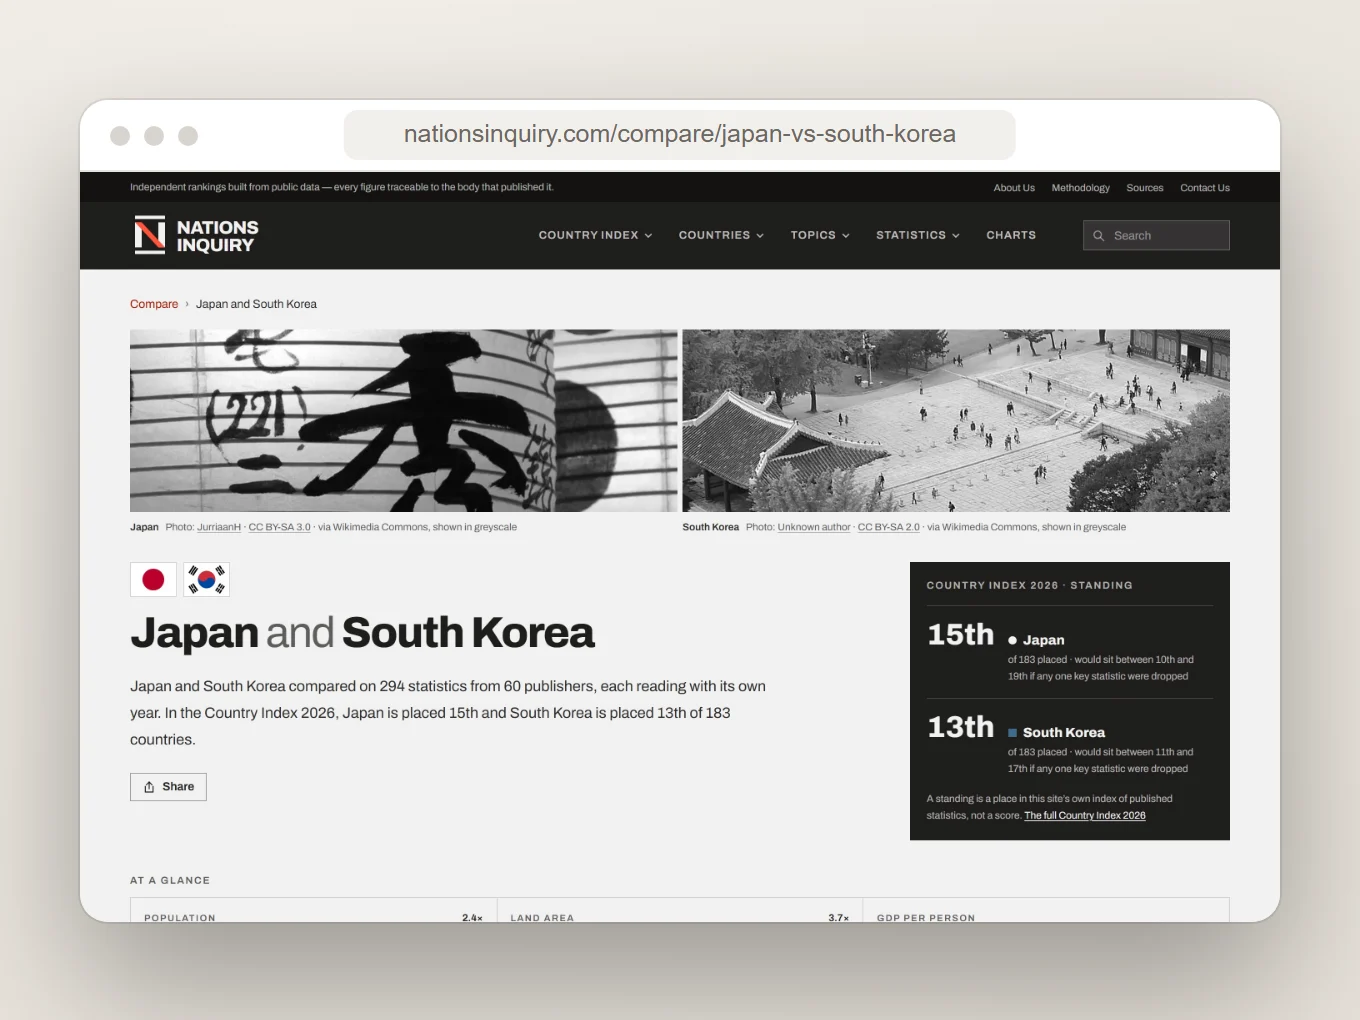
Visitors can search for a country, see it on the map, follow its trends, compare it with a neighbor or read the full method. When a country doesn't have enough data to be ranked, the site says so and explains why instead of filling the gap.
Development
Start anywhere.Go as deep as you like.
Nations Inquiry is one connected structure, not a pile of separate reports. Countries, regions, topics, statistics, charts and comparisons all link to each other, so a visitor can arrive on any page and still find the source behind a number.
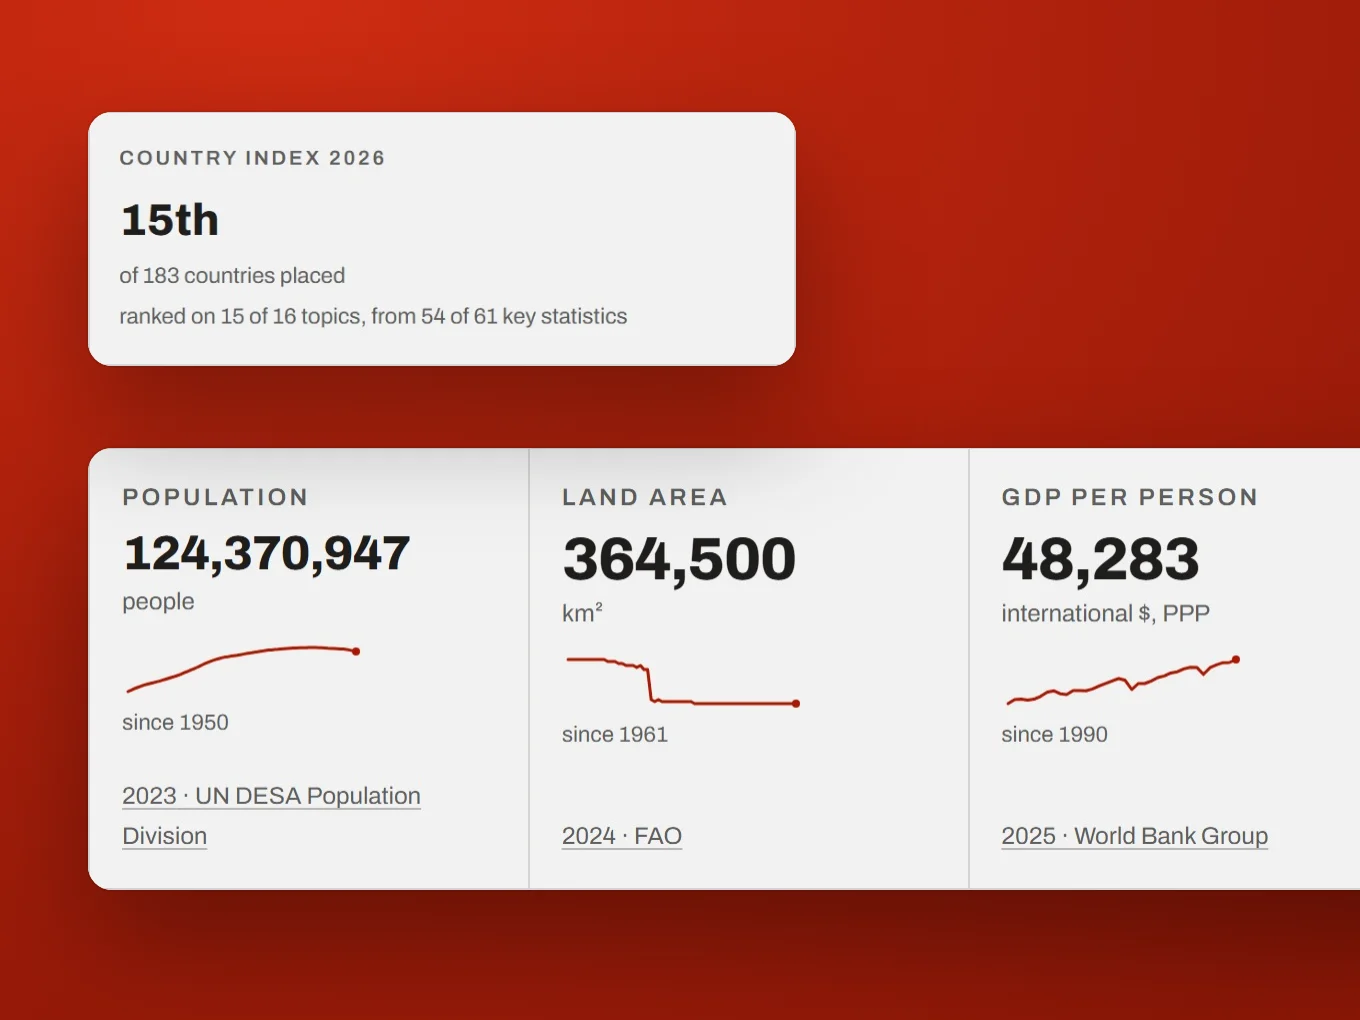
Country profile
Build method
A custom Next.js front end. Pages are prepared in advance and cached, which keeps a very large site quick to open.
A registry behind every page
Every statistic is catalogued with its publisher, edition, year and license, so country pages, rankings, charts and comparisons all cite the same source. Seven tests decide which statistics can vote in the index, and once an edition is published it is frozen, never rewritten.
Built with
- Next.js
- React
- Interactive maps
- Data visualization
- Structured data
Engineering & delivery
From concept to launch.
A reference this size only works if people can find it, open it quickly and read it on any screen. Those three goals shaped the build.
Discoverability
Built to be found
People don't search for a data platform. They search for one country, one topic or one statistic, so each of those needed a home of its own.
- Country pages
- Topic pages
- Internal linking
- Structured data
Project goal
Go beyond one-off infographics
Give search engines and visitors something lasting to land on for a single country, subject or figure.
What we built
A page for every question
225 country profiles, 18 topics, a page for every statistic and ready-made comparisons, tied together by site-wide search and internal links. Country pages also carry Dataset structured data.
Performance
Quick at any scale
With hundreds of statistics on a single country page, weight was always going to be the risk.
- Pre-rendering
- Caching
- Image optimization
Project goal
Keep a very large site light
Long tables, maps and charts can easily slow a page down, most of all for people on phones and weaker connections.
What we built
Pages ready before you arrive
Pages are pre-rendered and served from cache rather than built on every visit, and images are resized and compressed through Next.js.
Experience
Dense data on a small screen
A ranking with 16 subject columns was never going to fit on a phone as it stands.
- Phone layouts
- Data tables
- Touch navigation
Project goal
Keep every figure on mobile
The goal was a comfortable phone experience that didn't quietly drop columns or hide detail to make things fit.
What we built
Layouts that adapt to the data
Stat grids fold into two columns, section menus slide sideways and the main menu tucks behind one button. Wide tables scroll inside their own frame, so the page itself never overflows.
Project gallery
More of the work.
Next project
All work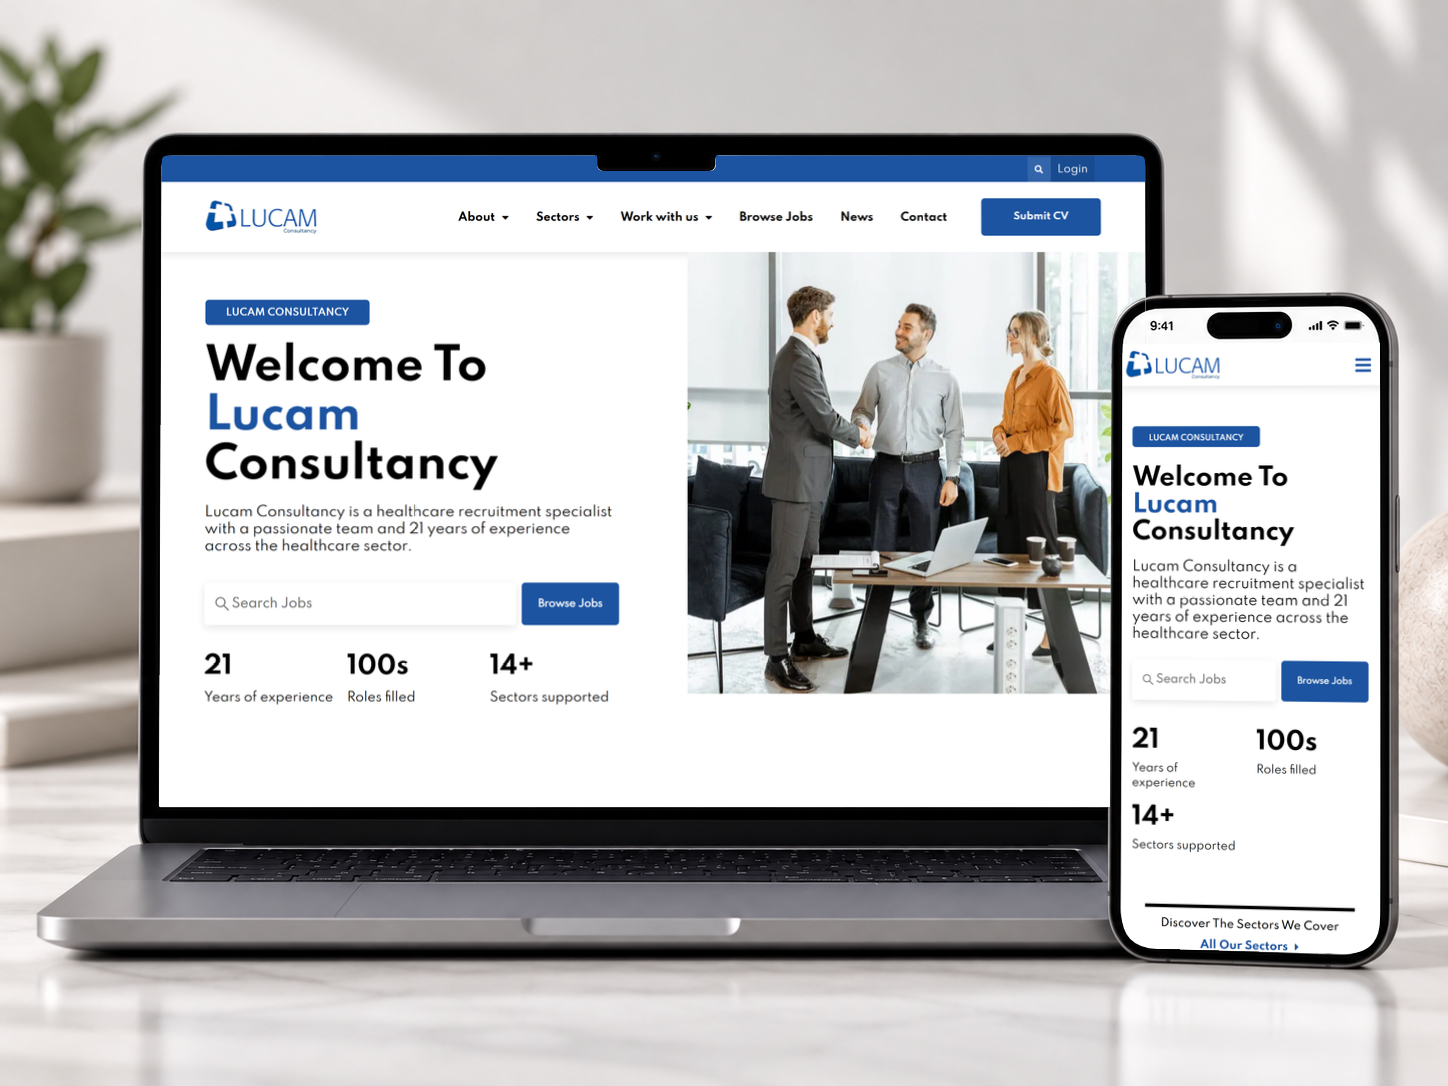
WordPress Website
Lucam Consultancy
A Figma design turned into a working Elementor website for Lucam Consultancy, a UK healthcare recruitment specialist, with sector pages, a job board and clear routes for employers and candidates.
Get in touch
Let’s buildwhat’s next, together.
Need a new website, a stronger brand or more customers? Tell us what you have in mind and we’ll help you plan the next step.